|
|
Stock Market Visualization
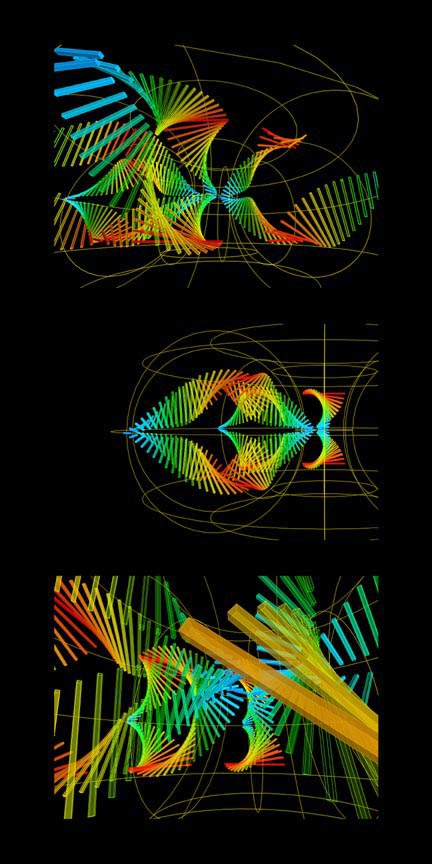
This 3-dimensional model for the visualization of the Stock Market is one example of a new kind of "intelligent architecture" that could redefine digital space. This architecture of information is determined by, and continually evolving in order to reflect, the data it represents. How the information is translated into 3-dimensions, however, must be designed. The need for the design of such visualization tools creates new opportunities for architects, who posses a unique understanding of visual ordering systems and spatial relationships. This not only opens up new areas for the practice of architecture, but it defines a different kind of fluid, virtual, architectural space, which could be designed by a new generation of "information architects". Stock Market Visualization
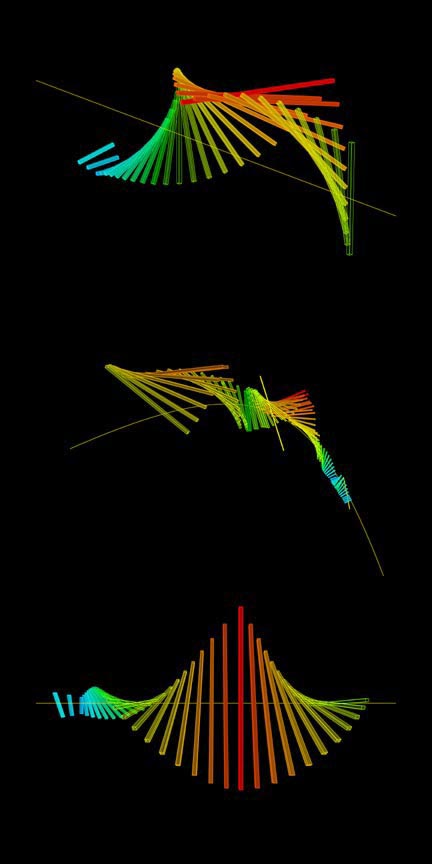
This project designed for CROMDI (Center for the Representation of Multi-Dimensional Information) as a study for the development of a Stock Market visualization program, looks at more effective ways of representing and tracking data from the Stock Market 3-dimensionally. In this scheme variables associated with a stock's price, stability, momentum and volume of trading, are represented through the color, size, rotation, opacity and position of each segment relative to a point of equilibrium. The visualization tool represents a stock's condition at any given period of time and allows it to be analyzed and compared to other stocks. The images above demonstrate the tracking of individual stocks while the images below represent various stocks in a portfolio.